jqPlot는 차트를 그려주는 jQuery 플러그인입니다.
jqPlot 튜토리얼을 진행해보도록 하겠습니다.
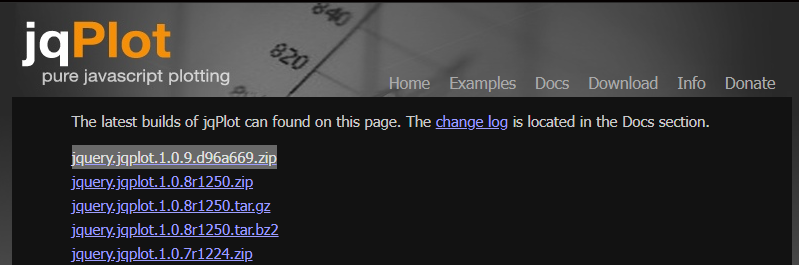
1. jqPlot download (http://www.jqplot.com/)
튜토리얼에는 가장 최신 버전인 jquery.jqplot.1.0.9.d96a669을 사용하였습니다.

2. js, css 파일 확인
차트 그리기에 필요한 jquery.jqplot.js, jquery.jqplot.css 파일이 있고,
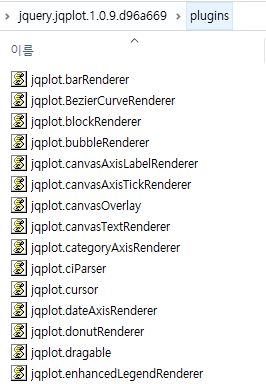
plugins에 다양한 기능을 제공하는 js 파일들이 들어있습니다.
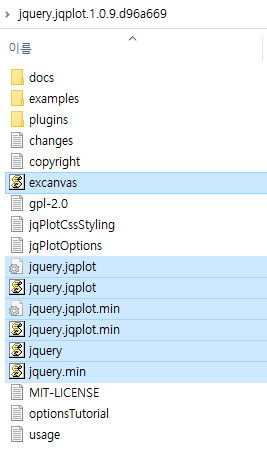
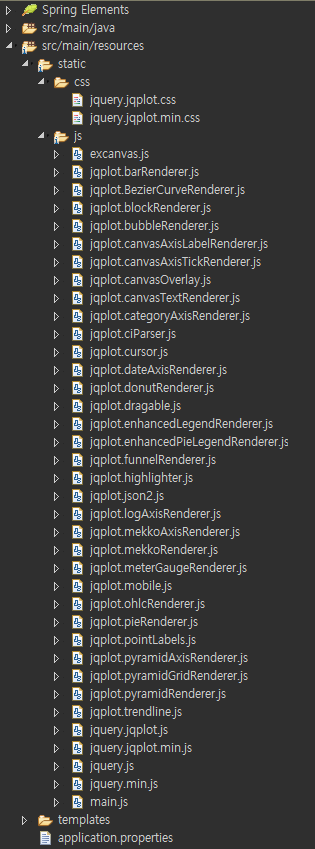
본인의 웹 프로젝트에서 원하는 경로에 넣어주면 됩니다.
3. View 코드 작성
본 튜토리얼에서는 Springboot 기반 Mustache 템플릿 엔진을 사용하였습니다.
코드는 아래와 같습니다.
<!DOCTYPE html>
<html>
    <head>
    	<script type="text/javascript" src="resources/js/jquery.js"></script>
	<script type="text/javascript" src="resources/js/jquery.jqplot.js"></script>
	<script type="text/javascript" src="resources/js/jqplot.dateAxisRenderer.js"></script>
	<script type="text/javascript" src="resources/js/jqplot.highlighter.js"></script>
	<script type="text/javascript" src="resources/js/jqplot.cursor.js"></script>

	<script src="resources/js/main.js?v=<%=System.currentTimeMillis()%>"></script>
	<link rel="stylesheet" type="text/css" href="resources/css/jquery.jqplot.css" />
    </head>

    <body>
    	<div id="lineChart" style="height:400px;width:1200px; "></div>
    </body>
</html>
jqplot 플러그인을 먼저id="lineChart"는 jqPlot로 그린 차트를 보여주기 위한 Element입니다.
4. js 코드 작성 (main.js)
var plot;
var chartData = [['21:30:01', 12]];		// [['21:30:01', 12], ['21:30:02', 15], ...]

$(document).ready(function() {
    renderChart();
    update();
});

function renderChart() {
    plot = $.jqplot('lineChart', [chartData], {
        title: 'Signal'
        , axes: {
            xaxis: {
               renderer:$.jqplot.DateAxisRenderer
               , tickOptions: {
                   formatString: '%H:%M:%S'
               }
    		   , min: '21:30:00'
    		   , max: '21:30:16'
    		   , numberTicks: 17
           },
           yaxis: {
        	   min: 0
        	   , max: 300
        	   , numberTicks: 11
           }
        }
        , cursor: {
        	show: true,
            zoom: true
        }
    });
}
$.jqplot()의 첫 번째 매개변수는 id 값이며, 두 번째 매개변수는 차트에 보여줄 데이터(X, Y)입니다.
x축(xaxis)은 renderer:$.jqplot.DateAxisRenderer로 설정하여 Date로 표현합니다.
Date로 표현하고 싶지 않을때는 생략하면 됩니다.
tickOptions의 formatString은 날짜 형식을 의미합니다. 데이터가 "21:30:01"이기 때문에, 형식은 "%H:%M:%S"입니다.
또한 tickOptions의 min, max는 최소 최대를, numberTicks는 몇 칸으로 표현할것인가를 의미합니다.
cursor의 show, zoom을 true로 설정해줌으로써, 차트를 줌인, 줌아웃(더블클릭) 할 수 있습니다.
var new_data = [15, 27, 35, 52, 85.9, 179, 193, 205, 230, 162, 130, 115, 95, 107];
var idx = 0

function update() {
    if (idx >= new_data.length) {
        return;
    }

    getChartData();
    setTimeout(update, 1000);      // 1초 단위
}

function getChartData() {
	date_str = (chartData[chartData.length - 1])[0];
	date = date_str.split(':');

	hour = Number(date[0]);
	min = Number(date[1]);
	sec = Number(date[2]);
	next_sec = String(sec + 1);

	new_date = (hour + ':' + min + ':' + next_sec.padStart(2, '0'))

	chartData.push([new_date, next[idx]]);
	idx += 1;

	reload();
}
update()는 new_data를 1초 단위로 차트에 추가로 표현합니다.
getChartData()는 chartData의 마지막 date를 기준으로 1초씩 증가하며 new_data를 추가합니다.
padStart(2, '0')은 sec 데이터를 두 자리로 표현하기 위해서 사용한다. 한 자리 데이터를 넣어주면 차트가 그려지지 않는다.
function reload() {
    plot = $.jqplot('lineChart', [chartData], {
        title: 'Signal'
        , axes: {
            xaxis: {
                renderer:$.jqplot.DateAxisRenderer
                , tickOptions: {
                    formatString: '%H:%M:%S'
                }
                , min: '21:30:00'
                , max: '21:30:16'
                , numberTicks: 17
            },
            yaxis: {
                min: 0
                , max: 300
                , numberTicks: 11
            }
        }
        , cursor: {
            show: true,
            zoom: true
        }
    }).replot();
}
reload()는 renderChart()의 동작과 같습니다. 차이점은 차트를 다시 그리기 때문에 plot.replot()을 사용합니다.
'Web & Mobile > JavaScript' 카테고리의 다른 글
| [JavaScript] Chrat.js 라인 차트 예제 (0) | 2022.01.25 |
|---|---|
| [JavaScript] 문자열 길이 구하기 (0) | 2020.09.24 |
| [JavaScript] setTimeout(), setInterval() 차이 (0) | 2020.08.11 |